|
iQue Forecyt® Reference Guide (Version 9.0)
|
Spillover Matrix
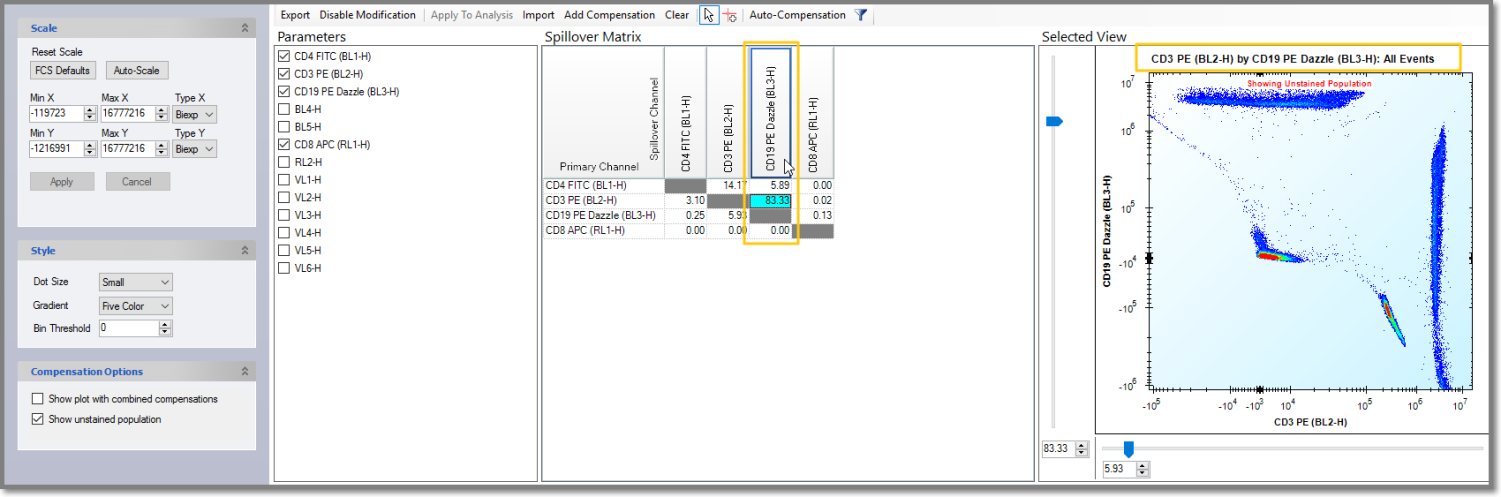
The Spillover Matrix displays a grid of parameters. Any point where two parameters are the same is disabled and marked by a gray box. All other positions display the current compensation spillover coefficient value. As shown in the following screenshot, when you click on a value, the box highlights in blue and the corresponding compensation plot opens in Selected View. Only one plot for any two parameters is displayed at a time in Selected View.
Plots displayed in the additional plots area are enabled and moved to the Selected View by double clicking on the plot.
Clicking on a spillover coefficient in the Spillover Matrix moves the plot to the Selected View. The X Parameter will be the row and the Y parameter will be the column.